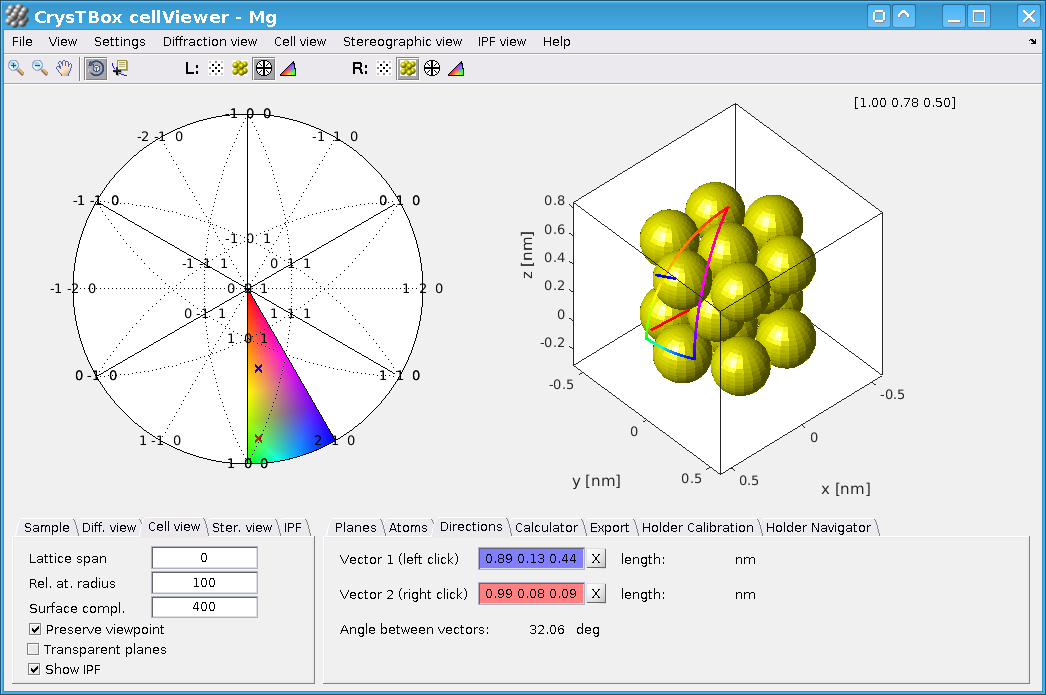
Detailed description of CrysTBox cellViewer window
This tool offers a user-friendly interactive interface showing the material from four different perspectives: direct atomic lattice (
Both, left and right views are interactive and interconnected: if you click at the diffraction spot in the

Input
Sample material
- defined by unit cell
- supported file formats: .CIF, .CELL
- some materials are predefined, but user can specify arbitrary material (details...)
Results from diffractGUI (optional)
- diffractGUI can pass the zone axis to cellViewer together with the information about the pattern orientation
- a theoretical diffraction pattern and atomic lattice orientation shown in cellViewer should then exactly match the experimental diffractogram
The interace

As mentioned above, the window has two views or slots (left and right), each of which can be occupied by  ,
,  ,
,  and
and  right below the main menu. Various properties and settings of individual views can be adjusted via main menu or more quickly via context menu and tabs in the bottom left part of the window. The tabs in the bottom right part of the windows show details about the selected crystallographic planes, directions, atoms, etc.
A detailed description of the graphical user interface follows.
Diffraction view

This view shows a theoretical spot diffraction pattern. It can be activated by pressing the toolbar button . Individual diffraction spots are represented by disks. The disk size is derived from a structure factor. Crosses represent extremely weak or forbidden reflections. The sample does not need to be oriented in the exact zone axis and therefore, the diffraction condition is not perfectly met for certain diffraction spots. Those reflection then does not appear black, but they are shaded in grayscale - the darker the spot appears, the better satisfied diffraction condition is.
The diffraction view is interactive. User can click on the spots to see the details about corresponding plane in the
The mouse actions available for this view are following:
- Left click
- Selects Plane 1 (blue).
- Shift + Left click
- Selects Plane 2 (red).
- Right click
- Shows the context menu.
Cell view

This is an interactive view on the unit cell (or a broader atomic lattice) which can be activated via toolbar button . The atoms are represented as spheres coloured according to their element. User can zoom in, zoom out and rotate the unit cell using the toolbar buttons  ,
,  and
and  . As the cell is rotated, the actual crystallographic orientation can be seen in the top right corner. The actual orientation of the rotated lattice may or may not be instantly reflected in the
Similarly to the
The mouse actions available for this view are following:
- Left click
- Selects atom (green).
- Shift + Left click / Ctrl+ Left click / Double Left click
- Selects atom even if the rotation mode is turned on (toolbar button is highlighted).
- Right click
- Shows the context menu.
Stereographic view
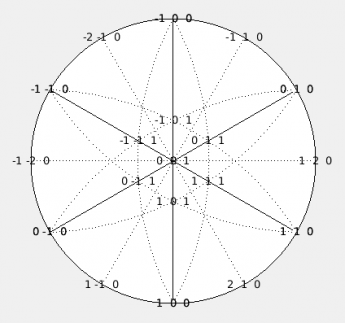
This view can be activated by the toolbar button . The view is quite intuitive. It offers a stereographic projection of selected planes and direction. The projection pole can be fixed or updated instantly to match the unit cell orientation in the
Clicking the plot, you can select planes or directions which are consequently shown in other views.
The mouse actions available for this view are following:
- Left click
- Selects Plane 1 (blue).
- Shift + Left click
- Selects Plane 2 (red).
- Ctrl + Left click
- Selects Direction 1 (blue).
- Ctrl + Shift + Left click
- Selects Direction 2 (red).
- Right click
- Shows the context menu.
IPF view

This view is quite similar to the . Compared to the
Clicking the plot, you can select planes or directions which are consequently shown in other views.
The mouse actions available for this view are following:
- Left click
- Selects Plane 1 (blue).
- Shift + Left click
- Selects Plane 2 (red).
- Ctrl + Left click
- Selects Direction 1 (blue).
- Ctrl + Shift + Left click
- Selects Direction 2 (red).
- Right click
- Shows the context menu.
Sample tab

Material - Sample material can be specified using this field.
Zone axis - User can set desired zone axis here. Chenge of this field is always instantly reflected in both, left and right views.
Diffraction view tab

This tab allows for a basic settings of
Max. spot index - Here, you can set maximum spot (plane) index of diffraction spots plotted in the
Diffraction view . Max. plane dev - This field specifies how tollerant the
Diffraction view is to declination of actual orientation from the perfect zone axis. The higher is the value, the higher declination from the ideal zone axis is allowed to draw the spot in the diffractogram. Note, that the declination is reflected in the darkness of respective diffraction spot - the higher is the declination, the brighter is the spot. View range - Specifies X and Y axes limits of the diffractogram.
Update zone axis from Cell view - If checked, the diffractogram is redrawn instantly as the unit cell is rotated in the
Cell view .
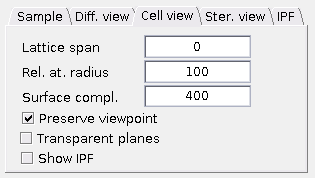
Cell view tab
Basic settings of the
Lattice span - Controls how many atoms are shown in the
Cell view . Zero denotes "human friendly" unit cell (e.g. whole hexagon in case of HCP structure). Numbers higher or equal to one stand for a block of NxNxN "true" unit cells. Higher number of atoms may result in increased hardware requirements. Rel. at. radius - Using the Relative atomic radius, you can set size of spheres representig the atoms as percent of distance between the two nearest atoms in the structure. In other words, value of 100 means, that two nearest atoms in the unit cell will touch each other. Numbers higher than 100 make some of the atoms intersect with each other, while Numbers lower than 100 make the
Cell view sparser and easier to see through. Surface complexity - Each atom visualization (sphere) consists of many flat faces. Number of the faces can be set here. Higher numbers make the atoms smoother. Higher number of faces may result in an increased hardware requirements.
Preserve viewpoint - The
Cell view viewpoint is reset (to given zone axis orientation) after aplying someCell view changes (such asSurface complexity ,Rel. at. radius and so on). This checkbox allows to preserve the unit cell orientation set by the user (e.g. by rotation, TEM holder tilting etc.). Transparent planes - This checkbox makes the planes in the
Cell view transparent, so that the atoms behind them can still be seen.
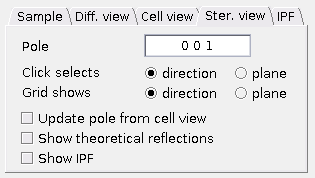
Stereographic view tab
Here you can control the
Pole - Miller indices of the direction corresponding to the projection pole can be set here.
Click selects - This radio button determines whether the left mouse click selects a direction or plane. The other one can be selected with Ctrl.
Grid shows - Here it can be specified, whether the grid reflects directions or plane normals.
Update pole from cell view - This checkbox allows the projection pole and upper direction to be automatically updated if the unit cell is rotated.
Show theoretical reflections - If checked, the theoretical planes (corresponding to the reflections in the diffractogram) are shown in the stereographic projection.
Max. spot index fromDiffraction tab applies here. Show IPF - Appearance of the IPF in the
Stereographic view can be controlled here.
IPF view tab

The IPF can be adjusted here. Advanced settings is available in the main menu.
Pole - The IPF pole (corresponds to the bottom left/right corner) is specified here as a direction vector in Miller indices.
Right/Left corner - The side corner of the IPF triangle is set here as a direction vector in Miller indices.
Upper corner - The upper corner of the IPF triangle is defined in this field as a direction vector in Miller indices.
Click selects - This radio button determines whether the left mouse click selects a direction or plane. The other one can be selected with Ctrl.
Show theoretical reflections - If checked, the theoretical planes (corresponding to the reflections in the diffractogram) are shown in the stereographic projection.
Max. spot index fromDiffraction tab applies here. Coloured IPF - This checkbox switches between white and coloured IPF.
Planes tab

This tab states details about the planes either given by a mouse click to the views or entered manually using fields
Plane 1 - This field states the Miller indices of Plane 1 (the blue one). It can be filled manually or automatically after clicking to the
Diffraction view ,Stereo view andIPF view . Plane 2 - This field states the Miller indices of Plane 2 (the red one). It can be filled manually or automatically after clicking to the
Diffraction view ,Stereo view andIPF view . d-spacing - D-spacings of both planes
Plane 1 andPlane 2 are stated here. Interplanar angle - If both planes,
Plane 1 andPlane 2 , are specified, an angle between them is printed in here.
Atoms tab
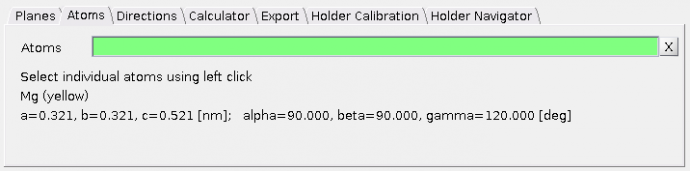
Details about atoms selected by the mouse-click in the
- one atom - element, atom coordinates (Miller and Cartesian)
- two atoms - elements, direction of vector between the two atoms (Miller and Cartesian) and their distance (Miller and Cartesian)
- three atoms - elements, plane normal vector (in Miller and Cartesian coordinates)
- four atoms - elements, plane normal vector (in Miller and Cartesian coordinates) and d-spacing
Directions tab

This tab states details about the crystallographic directions either given by a mouse click to the views or entered manually using fields
Vector 1 - This field states the Miller indices of Direction 1 (the blue one). It can be filled manually or automatically after clicking to the
Stereo view andIPF view . Vector 2 - This field states the Miller indices of Direction 2 (the red one). It can be filled manually or automatically after clicking to the
Stereo view andIPF view . Length - Lengths of
Direction 1 andDirection 2 are stated here. Angle between vectors - If both directions,
Direction 1 andDirection 2 , are specified, an angle between them is printed in here.
Calculator tab

This tab offers a crystallographic calculator. After selecting the quantity to be calculated in the pop-up menu, the descriptions of required parameters appear next to the text fields. When all the inputs are set correctly, the results are printed at the right hand side of the tab.
Supported calculations involve:
- conversion between Miller and Bravais notation for planes and directions
- conversion between Miller and Cartesian coordinate system for planes and directions
- enumeration of interplanar and interdirectional angles
- d-spacing enumeration and assignment
- calculation of structure factor, atomic scattering amplitude or extinction distance
Export tab

Some of the crystallographic quantities can be exported to a text file using this tab.
Input parameters - This panel is used to set the calculation inputs - mainly the range of Miller indices of enumerated planes. Some calculations also require the acceleration voltage.
Exported quantities - Quantities exported to the table are specified here using the checkboxes.
Export file - In this tab, you can specify character separating individual values in the table using
Separator pop-up menu. Then, you can launch the exporting procedure pressing the buttonExport . Status of the procedure is stated bellow.
Holder calibration tab

This tool allows you to simulate the TEM sample holder. Some basic calibration is required for this purpose. Holder visualization on the right hand side of the tab should help the user to check, whether all the values have been set correctly.
Holder azimuth - This field specifies orientation of the holder with respect to the sample orientation currently shown in the
Cell view . This value is an angle between alpha tilt axis and Y (vertical) axis in degrees.
Direction of positive rotation angles - These pop-up menus allow you to specify whether the positive angles tilt the holder to the right or left for alpha tilt and upwards or downwards for beta tilt (watching from the holder handle towards the holder tip).
Tlts leading to shown unit cell orientation - These fields are used to set alpha and beta tilt (in degrees) corresponding to the sample orientation as currently shown in the
Cell viewer . Calibrate - If all previously mentioned values are set and the holder visualization agrees with the reality, calibration can be confirmed pressing this button.
Holder navigator tab
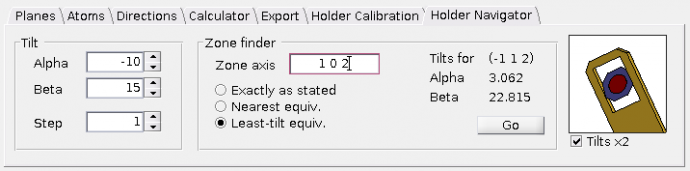
This panel allows you to simulate TEM holder tilts. It can also calculate holder tilts required to get the sample to desired orientation.
Note: If the fields in this tab are not enabled, please perform the calibration using the
Tilt - Text fileds
Alpha andBeta (in degrees) can be used to tilt the sample in theCell view and to see corresponding diffraction pattern in theDiffraction view (if the checkboxUpdate zone axis from cell view in panelDiffraction view is check-marked). Zone finder - This panel allows you to find the alpha and beta tilts leading to the desired zone axis. Ususally, the TEM holder tilts are limited to a certain range. Therefore, you can select whether you want to be navigated exactly to the zone axis which is stated in the text field (radio button
Exactly as stated ) or rather to such crystallographically equivalent zone axis, which is nearest to the actual sample orientation (radio buttonNearest equiv. ) or to the crystallographically equivalent zone axis with the least holder tilts (radio buttonLeast-tilt equiv. ).