Lorentz-Drude models of material permittivity
Comments
Introduction
The permittivity spectra of a material are often the sufficient information to assess its optical behaviour, including the index of refraction, losses, reflection from its surface etc.
I tried to collect as many legal experimental sources as possible and to compile them to one graph (colour lines). Some of the sources provide complex permittivity function ε or Lorentzian parameters - then not only ε, but also the index of refraction n = Re(√ ε ) and index of absorption k = Im(√ ε ) could be plotted easily. In most articles, however, only the n and k spectra are presented so it would be too tedious to interpolate them to get ε and I did not do it. Finally, I tried to propose a Lorentzian model for each material and plotted it over the experimental data as a black curve. One day I will surely extend this page to all materials that exist in the Universe.
The data compiled on this page are freely available for your research or amusement. I can not guarrantee they are not wrong or imprecise. They may be especially useful for:
- precisely simulating structures built of these materials,
- understanding solid-state physics, and
- assessing the usefulness of a given material for optical applications at some wavelength.
Various notes
A simple approximative model of permittivity was built here as a sum of Lorentzian oscillators, however it usually works well only in the far- and mid-infrared where discrete optical phonons reside. For many materials, such as silica, the Lorentz model built of discrete oscillators predicts much higher losses in the near-infrared - with Lorentz model, one probably could not look through the glass window. At the blue and ultraviolet range the curves are generally much more complicated, yet they can be reasonably fit by few overlapping Lorenzians (I did not care much about precision for UV above 1015 Hz). At VUV and X-ray, the Lorentzian oscillators seem to be able to fit the narrow absorption peaks, but I did not do it (even though beautiful experimental data are often available here).
The data presented are approximate. I did not investigate in details the experimental sources to compare preparation techniques etc.
Some materials, such as rutile, are strongly birefringent. I plotted permittivity along the e, o axes separately, and also their average.
To use the data in some FDTD simulation, you will probably need to remove the high-frequency oscillators (for stability) and the too-low-frequency oscillators (for speed). The "sigma" parameters of all removed high-frequency oscillators then has to be added to the high-frequency permittivity of the given material.
Click the images to see a really big plot.
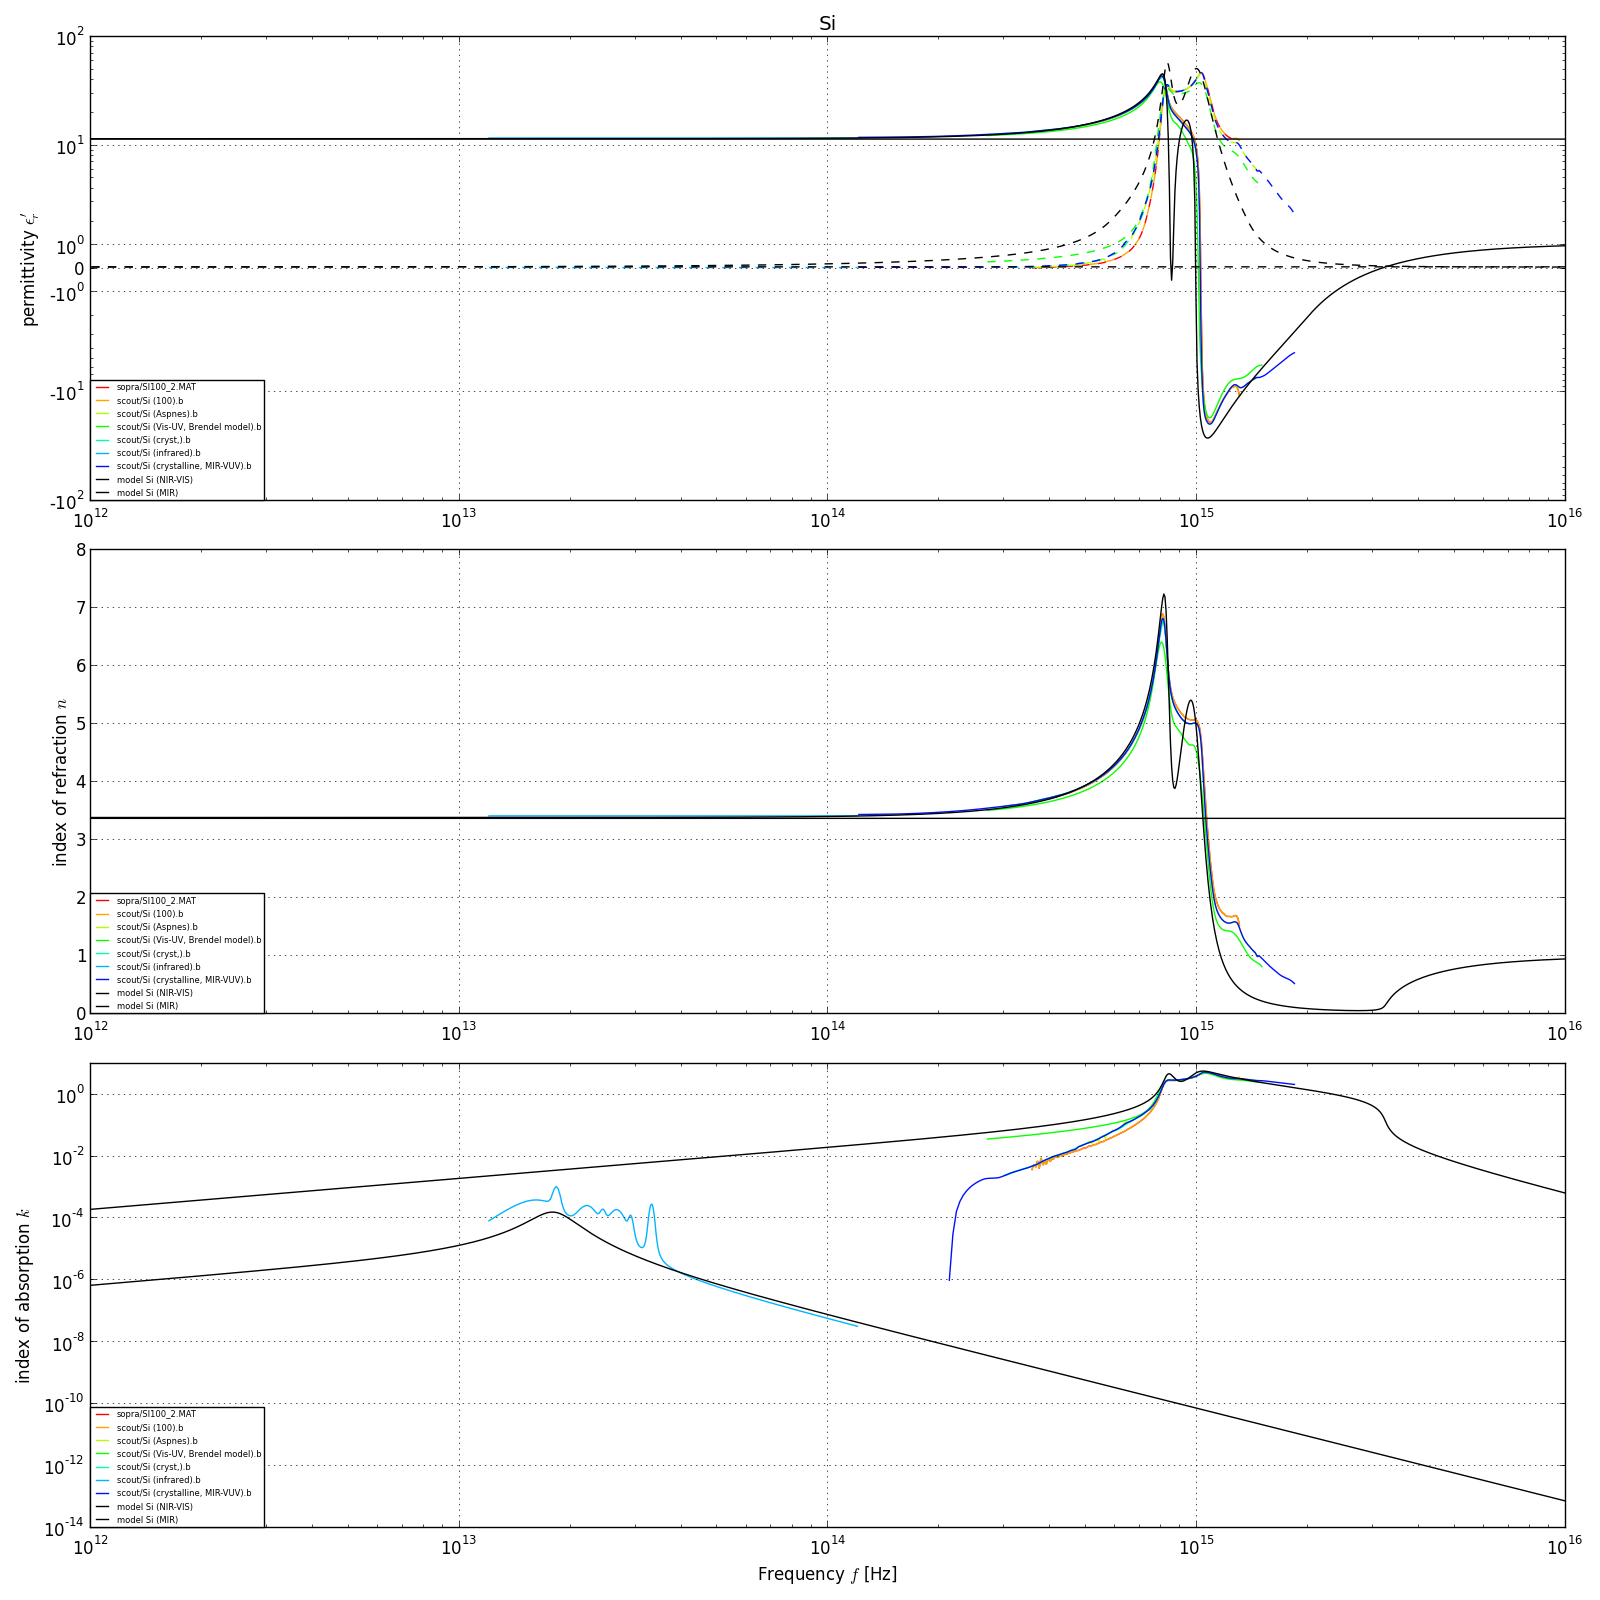
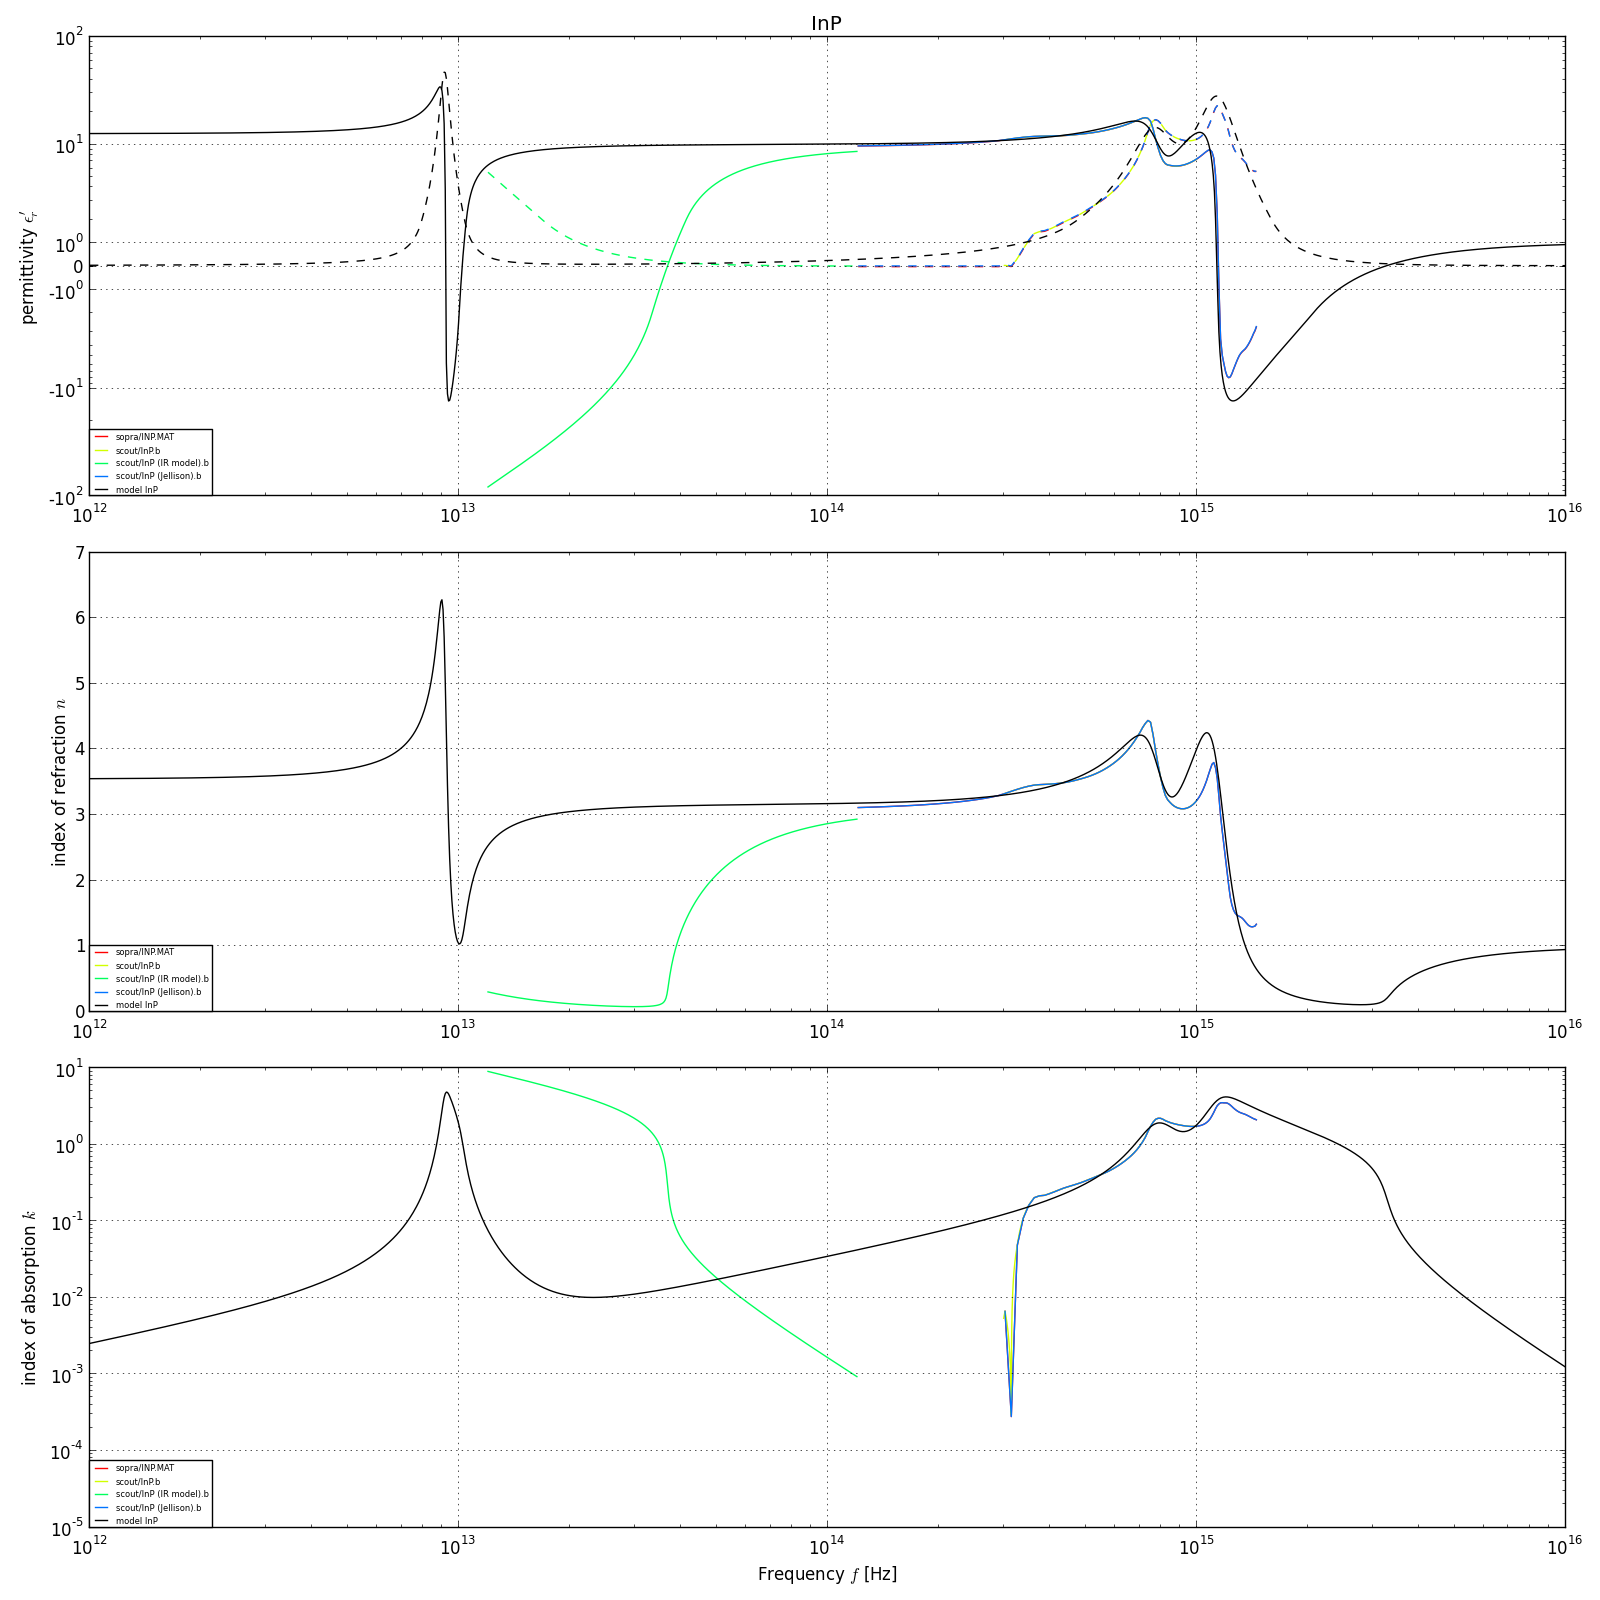
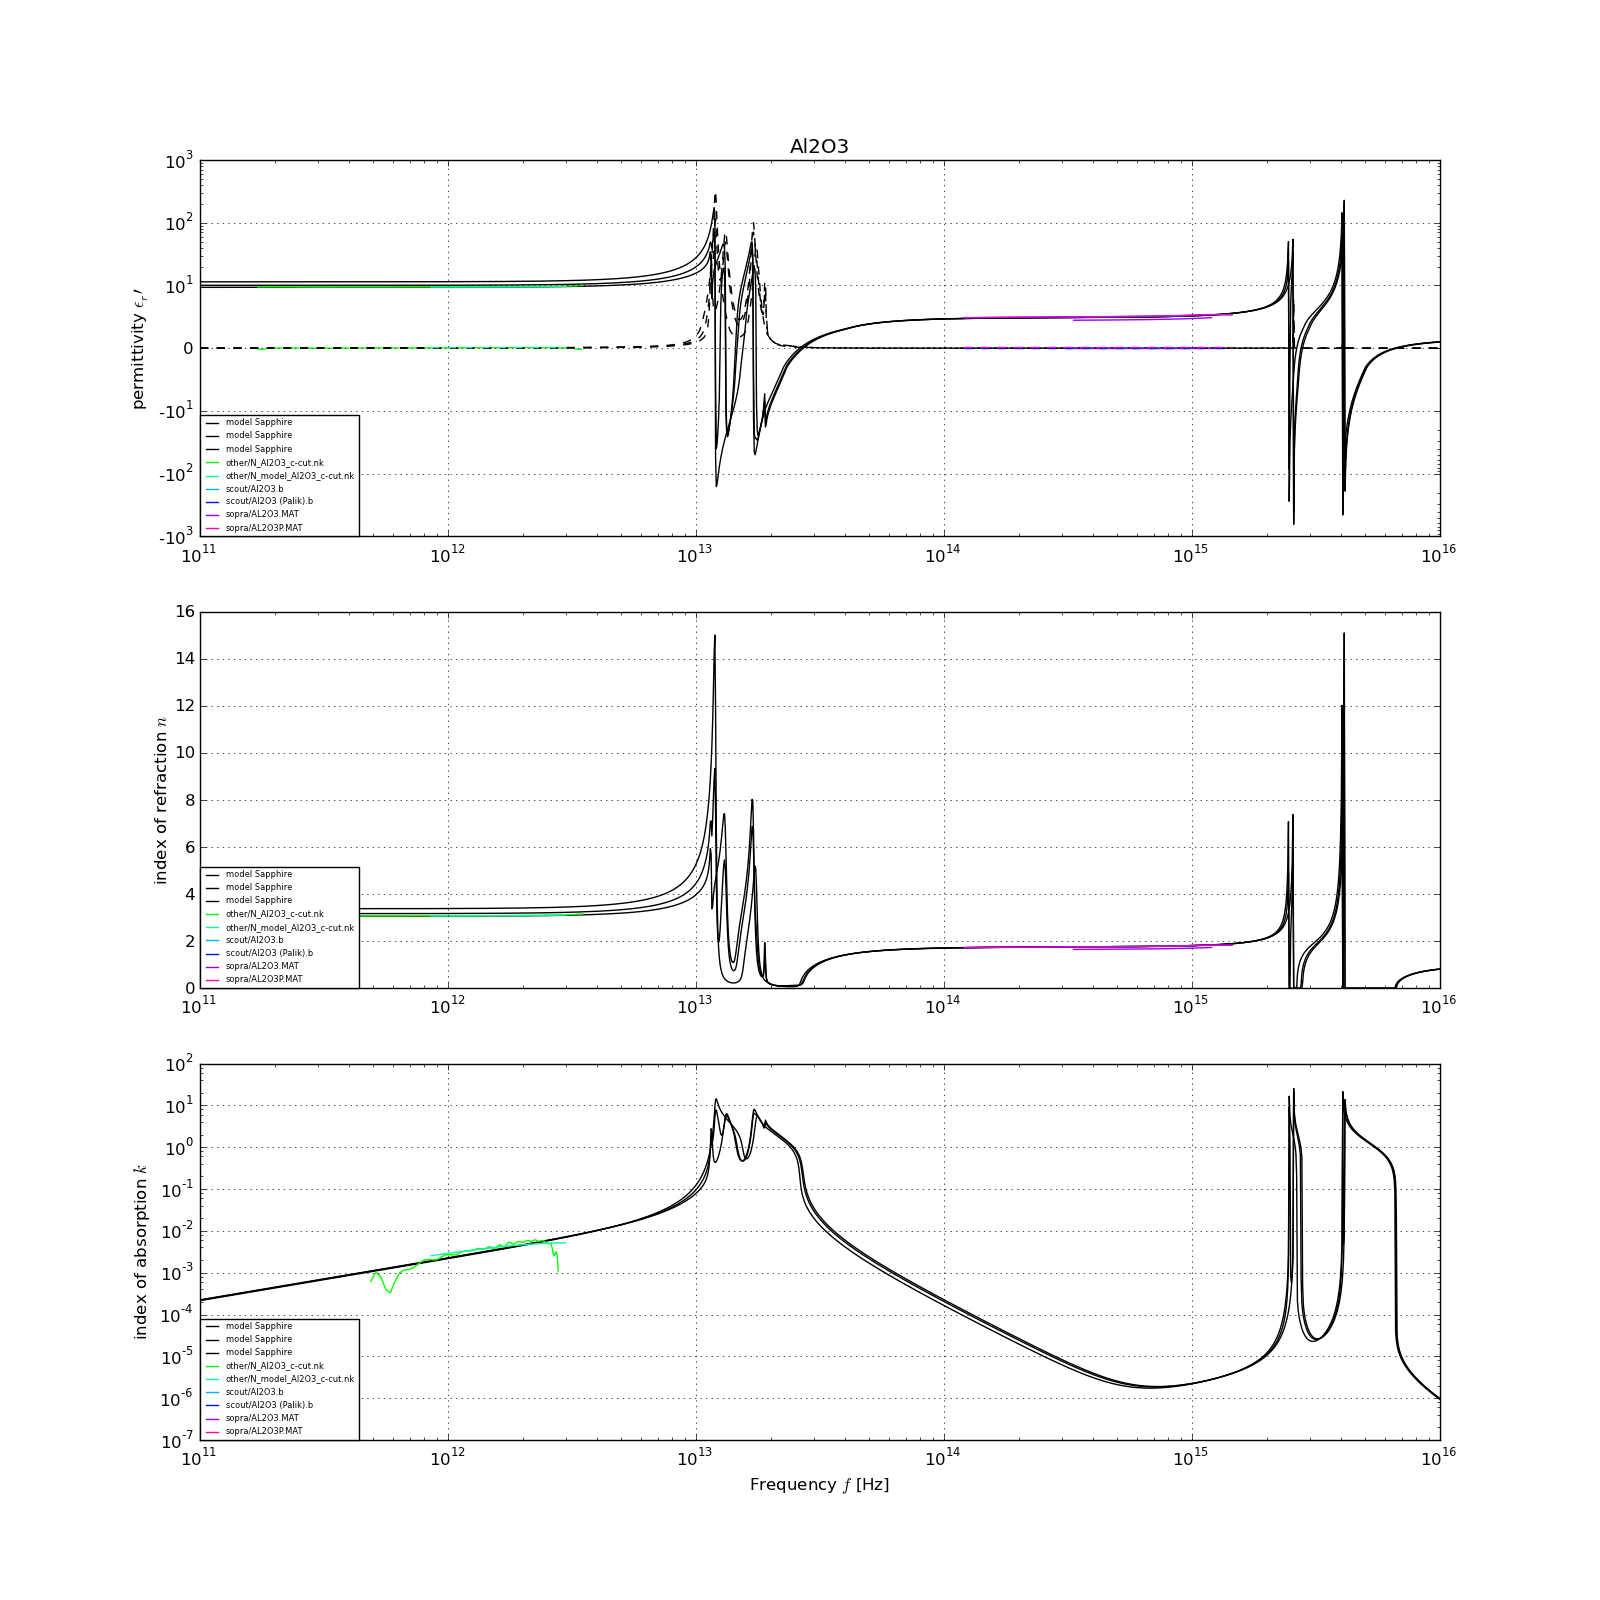
Note that the x-axis is common for all three graphs from the picture and it is in logarithmic frequency. The y-axis is different for the three graphs: the upper one uses symmetric logarithmic, the middle one linear and the bottom one logarithmic data.
Development and sources
Several sources of data were used. They are listed at my MEEP page, where you find also additional information on simulations, Lorentz model and searching for the permittivity data.
Although the SOPRA and SCOUT databases can be downloaded from their official websites, I am not sure if I am allowed to redistribute them with my scripts, so the data from the sopra and scout databases have to be downloaded from their providers, if you wish to plot them. Here I provide the plotting script with the sources that are free to distribute. The script not only allows one to replot the following graphs (using Python+Matplotlib), but also provide the parameters of the Lorentzian model, some comments etc.
Dielectrics and semiconductors
Silicon (Si)
Note: The optical spectra can not be fit well with the discrete Lorentz oscillators. Two curves were plot, one valid for THz-infrared range, the second one for optical range.
Silica (SiO2)
Plenty of experimental data for amorphous silicon dioxide are available. Note that the absorption in NIR range is in fact much lower than predicted here. Again, the optical spectra can not be fit well with the discrete Lorentz oscillators.

Silicon carbide (SiC)

Gallium arsenide (GaAs)
The damping frequency of the optical phonon oscillator around 9 THz could not be reliably determined.

Rutile (TiO2)
Rutile is birefringent: three curves were plot for ordinary, polycrystalline and extraordinary permittivities. Spectra from TDTS measurement of polycrystalline rutile added (purple line).

Indium phosphide (InP)
Note: The SCOUT database predicts very weird mid-IR response for indium phosphide; it seems to me that they measured on a heavily doped sample with plasma frequency around 36 THz. In practice, the spectra should rather look as plotted by the black curve; see the source of meep_materials.py for details.
Indium antimonide (InSb)
Note: unable to get the mid-IR spectra here, model not constructed.

Strontium titanate (STO, Sr Ti O3)
STO is a ferroelectric whose low-frequency permittivity strongly depends on the temperature.
The permittivity curve between 5-50 THz is unsure, only one and incomplete experimental data range was used.

Sapphire (Al2O3)
Sapphire is birefringent, especially in the THz range. The extraordinary axis exhibits higher permittivity here. Three curves were plot to account for ordinary, extraordinary and averaged orientation.
Metals
Gold (Au)
