Detailed description of CrysTBox ringGUI Window
The application window consists of two figures and several panels. The figures allow the user to see the input image and a graphical interpretation of some results. The surrounding panels allow to control the analysis procedure and list some results.
A detailed description of the graphical user interface follows.
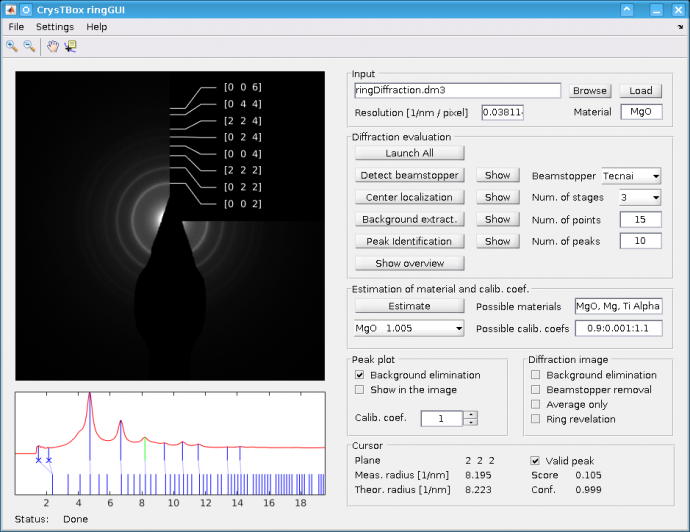
Diffraction image
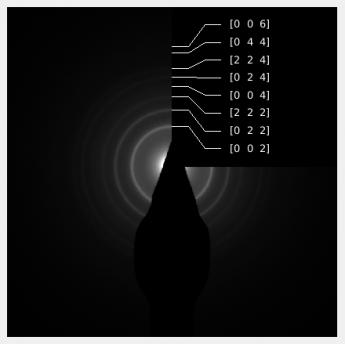
This figure shows the input image and/or some graphical visualization of some results. This particular example shows an identification of diffraction rings and can be obtained using button
Peak plot

The diffraction profile is plotted here once it is known. The profile is a circular average of the image intensity as function of distance from the ring center. The left border of the plot corresponds to the ring center, while the right one corresponds to the image border. Vertical blue lines in the bottom part of the plot stand for the theoretical ring radii specific to the sample material. Vertical blue lines in the upper part (in the profile) represent the ring radii measured in the experimental image. Light-blue lines in between illustrate the assignment between the measured radii and their theoretical counterparts. This plot is interactive. You can click the blue lines corresponding to either theoretical or experimental d-spacing and you should see details in
Input panel

This panel contains information about the input image.
Browse - This button allows you to find the input image in the directory structure.
Load - Loads given input image.
Resolution - The image resolution can be set manually here.
Material - The sample material can be specified using this field.
Diffraction evaluation panel

The analysis procedure can be controled using this panel. The whole procedure can be launched at once by single click on the
Launch all - This button launches all the analysis steps at once.
Detect beamstopper - The algorithm requires the beamstopper to be detected. This can be done manually or automatically for the known beamstoppers. Resulting beamstopper mask is shown once this step is completed. If the mask does not fit the beamstopper correctly, the user shall outline the beamstopper manually. Manual localization can be performed by setting the pop-up menu
Beamstopper to "Manual" and then clicking the buttonDetect beamstopper . Beamstopper - This pop-up menu specifies type of the beamstopper for automatic detection or manual localization.
Center localization - This step localizes center of the diffraction rings. This can be done automatically in several stages (see
Num. of stages) or manually. Num. of stages - This pop-up menu defines number of stages for the automatic centre localization. The higher is the number of stages, the more precise and time consuming the localization is. User can also localize the centre manually setting the value to "Manual"
Background extract. - Typically, there is some background in the diffraction image - central parts of the image are brighter compared to the image borders. This button is used to extract the background from the image, which is necessary for precise and reliable ring localization.
Num. of points - The background is approximated by a hyperbolic function touching the diffraction profile from bellow. Number of points, where the hyperbola should touch the diffraction profile is specified here.
Peak identification - This step localizes certain number of the highest peaks in the profile.
Num. of peaks - Number of the highest peaks to be localized (and subsequently crystallographically identified) in the diffraction profile can be specified in this field.
Show overview - Shows an assignment of the plane indices to the diffraction rings into the diffraction view.
Panel for Estimation of material and calib. coef.

If the sample material is not known, the tool can select the most appropriate one from the list given by the user. Similarly, the calibration coefficient can be determined - the user can specify a range of possible values and the algorithm automatically finds the one which best fits the experimental data. Both functionalities can be combined together, so that ringGUI searches for the most appropriate material and calibration coefficient at once.
Possible materials - Comma-separated list of possible sample materials (see
Material for details). Possible calilb.coefs - Range of possible calibration coefficients (see
Calib. coef. for details). Estimate - Button launching the estimation of the material and/or calibration coefficient.
- MgO 1.005 (pop-up menu with estimation results)
- Several best-scored combinations of the material and calibration coefficient are stated in this pop-up menu. Selection of particular menu entry automatically sets given sample material and calibration coefficient (calibration coefficient is adjusted, theoretical ring radii are redrawn and assignments to the experimental radii are recalculated).
Peak plot and Diffraction image panels

These two panels adjust the
Background elimination (Peak plot panel)- This checkbox specifies whether to eliminate the background from the
Peak plot (and from theDiffraction image ifShow in the image is selected). Show in the image (Peak plot panel)- The checkbox controls whether the diffraction profile is shown in the
Diffraction image . Calib. coef. (Peak plot panel)- This value allows for an adjustment of the camera length calibration inaccuracies. The measured ring radii are multiplied by this coefficient prior to the comparison with the theoretical ones.
Background elimination (Diffraction image panel)- Allows for a removal of the background from the diffraction image (see figure below).
Beamstopper removal (Diffraction image panel)- Removes the beamstopper from the image (see figure below).
Average only (Diffraction image panel)- Shows the intensities calculated from the circular average instead of the input image. This makes the image smoother.
Ring revelation (Diffraction image panel)- Makes the weaker beams more apparent (see figure below).
 |
 |
 |
 |
 |
| Original image | Background eliminated | Beamstopper removed | Rings revealed | All together |
Cursor panel
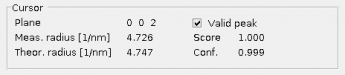 In this panel, one can see the details about the theoretical and experimental ring radii chosen using a mouse-click into the
Plane - Miller indices corresponding to the given radius.
Meas radius - Radius measured in the experimental image.
Theor. radius - The theoretical radius specific to the sample material.
Valid peak - This checkbox allows to exclude currently selected peak from the evaluation. Excluded peaks (denoted by small cross in the
Peak plot ) are not displayed in the overview (seeShow overview ) and they are not taken into account during the estimation of material or calibration coefficient (seePanel for Estimation of material and calib. coef. . Score - Score reflecting relative height of the peak.
Conf. - Confidence measure reflecting how the tool is confident, that current peak correspond to a ring in the image.